Fabric Hand feel evaluation by Fabric Touch Tester (FTT)

Fabric Touch Tester (FTT):

The Fabric Touch Tester (FTT) efficiently measures fabric hand in under five minutes per sample. The Fabric Touch Tester (FTT) is necessary to characterize the tactile sensory attributes of textile contact during wear. Fabric hand, the tactile sensation, traditionally gauges fabric quality. Despite its subjective nature, researchers strive to develop objective methods to quantify fabric tactile experiences in the textile and clothing industries.

Clothing, an integral part of daily life, intimately connects with our existence. It embraces our body, offering comfort from day to night. Our skin, with countless receptors, keenly senses pressure, friction, and heat exchange. Clothing’s thermal comfort significantly shapes our overall well-being, constituting 40% of total comfort perception. The skin’s remarkable sensitivity detects subtle touches, measuring less than 0.001mm.

Consumers’ clothing choices pivot on comfort, a subjective aspect. Fabric hand evaluation, extensively researched for a century, focused on assessing mechanical properties, with notable examples like Kawabata instruments, Fabric Assurance by Simple Testing (FAST), and Tissue Softness Analyzer (TSA). Yet, the downside stems from the prohibitively high cost and technical complexity of these instruments.

Fig: Fabric Touch Tester (FTT)

Fabric Touch Tester (FTT) indices, their units and usual interpretation:

Presenting 13 indices (Table 1) for each side of the fabric in both warp and weft directions, the FTT software subsequently calculates three key comfort indices—smoothness, softness, and warmness—as well as two global comfort indices—total hand and total touch. Transferring these indices to QC Evaluation Software establishes an electronic standard for assessing various production fabric lots, akin to a spectrophotometer’s role in color evaluation.

(Table 1)

Sl. No. Fabric Property Index Full Form Unit Used in FTT Software (SI unit) Interpretation
1 Bending BAR Bending Average Rigidity gf mm rad-1 (N m rad-1) This indicates the force required to bend
BW Bending Work gf mm rad (N m rad) This is the work needed to bend
 2 Surface Friction SFC Surface Friction Coefficient It expresses the coefficient of surface friction on the ribbed-plate’s surface
 3 Surface Roughness SRA Surface Rough-ness Amplitude µ m (m) It expresses the roughness irregular wave amplitude
SRW Surface Rough-ness Wavelength Mm (m) It expresses the roughness irregular wave wavelength
          4 Compression CW Compression Work gf mm (N m) The amount of Work required to compress the specimen
CRR Compression Recovery Rate This is the change in the Percentage of thickness after compression
CAR Compression Average Rigidity gf mm-3 (N m-3) This is the amount of force required to compress the specimen
RAR Recovery Average Rigidity gf mm-3 (N m-3) This is the force reflected during recovery of the specimen
CRR Thickness Mm (m) This is the thickness of the specimen
        5 Thermal Conductivity TCC Thermal Conductivity under Compression 10-3 W m-1 °C-1 (W m-1 °C-1) It is the energy transmitted during the compression of the specimen
TCR Thermal Conductivity under Recovery 10-3 W m-1 °C-1 (W m-1 °C-1) It is the energy transmitted during the recovery of the specimen
Qmax Thermal Maximum Flux W mm-2 (W m-2) It is the max energy trans-mitted during the time of compression

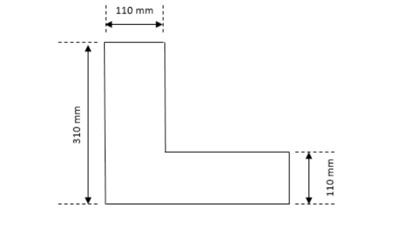
Sample Preparation and Working Method:

Condition specimens at 20°C ± 2°C and 65% ± 4% relative humidity. Arrange them in an L shape per Figure 1. Clearly indicate fabric direction (warp/weft or wale/course) and sides (outside/inside) before cutting. Use pressure cutting for accuracy. Prioritize a sensor check before processing each fabric batch. In the ‘run’ menu bar, initiate the self-check command. If sensors function within the given range, all pop-up window indications turn green after the test. A properly functioning sensor enhances the device’s value.

Figure 1: Fabric Sample Dimension

Position the specimen on the FTT instrument’s bottom plate, forming an L with its legs on opposite platforms. To replicate the skin-textile temperature difference, configure the upper plate 10°C higher than the bottom one. Initiate the test by slowly lowering the upper plate to contact the cloth. Lower the cloth further with both plates and raise it back after a brief period. Throughout the test, the fabric provides feedback to bending, compression sensors, and others. The FTT software, supplied by the manufacturer, computes measurements for both warp and weft directions, inside and outside the fabric.

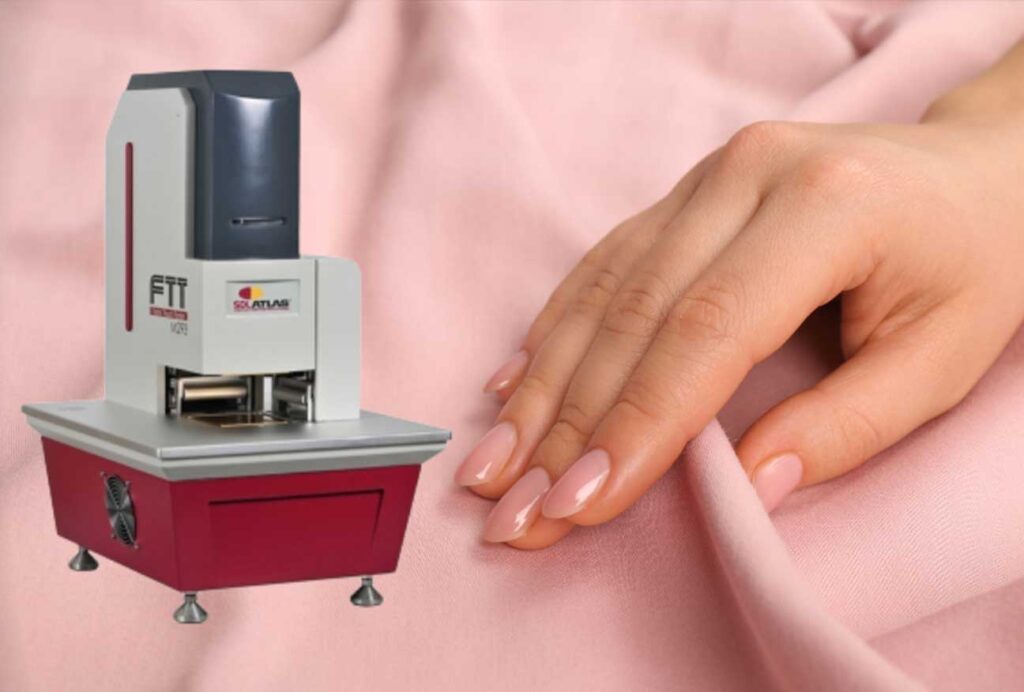
Machine Description:

The setup comprises five main components: the upper measuring head, bottom measuring head, cast aluminum frame, upper measuring head motion mechanism sub-system, and control/data acquisition and analysis software package. A pressure-sensing frame on the bottom measuring head assesses material bending behavior. For fabric surface roughness evaluation, the upper measuring head integrates a friction measurement disc. A vertical arm, connected to the motion control system, supports the upper planar measuring head plate with the friction-measuring unit. The plate is heated, typically 10°C higher than the surrounding air temperature, mimicking human hand conditions.

When you hold a specimen, fit the bottom surface with a thin film heat flux sensor (HFS-1, from OMEGAs) to measure the heat flow caused by the temperature differential between the two heads. For dynamically measuring torque changes during disc rotation on a specimen surface, mount a specially designed friction sensor with a strain gage on the axis of rotation. Monitor the temperature of the upper measuring head with another thermal resistance sensor (HEL-700 platinum RTD, Honeywells). Track compression changes using three pressure sensors in the bottom measuring head and four pressure sensors (FSL PK 80091, Honeywells) under the pressure-sensing frame.

As the arm descends, the specimen’s edges bend, enabling the measurement of bending forces. The arm continues until the platform contacts a stationary frame member, detecting the force and facilitating the evaluation of specimen compressibility. The device employs five types of transducers—measuring heat flux, pressure, friction, displacement, and temperature. All analog signals are received and processed by a computer.

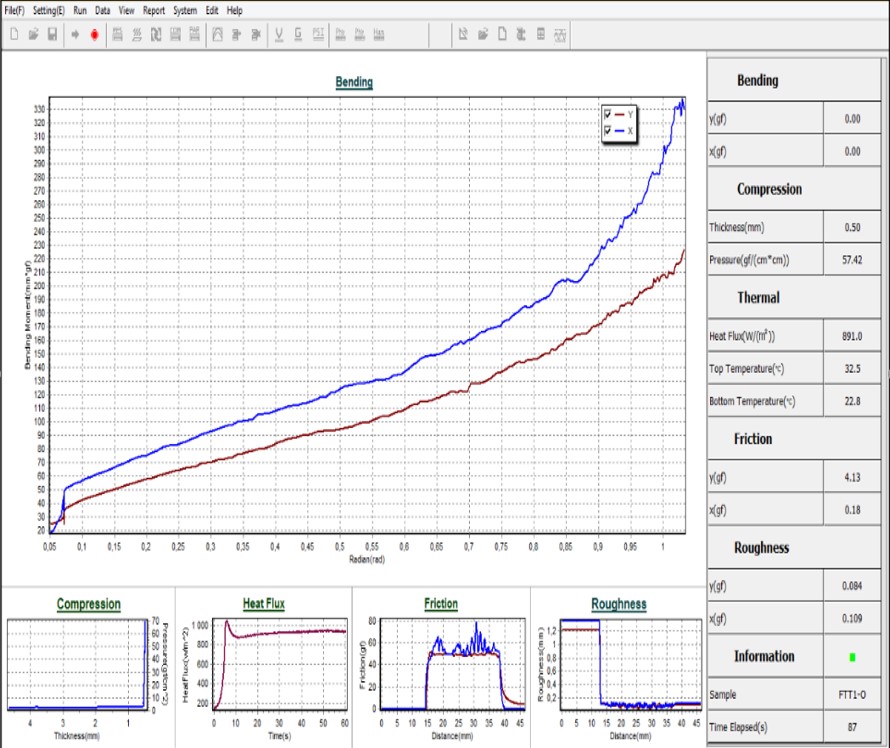
Result and Data Analysis:

Figure 2: An example of FTT main interface

Figure 3: Excel data of the obtained Test Result

Figure 2 displays the main interface of the FTT software. Upon completing the test, the software facilitates the creation of an index report. This report, in .xls format (Figure 3), encompasses the entire dataset of the 13 FTT fabric indices. Utilizing the Python stats models package or another robust statistical program, you can merge the index report with the previously suggested log file. This merging process enables additional statistical analyses on the dataset.

Evaluation of Fabric Touch Tester (FTT):

The Fabric Touch Tester (FTT) serves to measure, log, and analyze the mechanical and thermal sensory properties arising from the interaction of fabric and skin. Objective measurements demonstrate the FTT’s capacity to assess fundamental mechanical and thermal fabric properties. Furthermore, statistical analyses indicate that, under non-sweating conditions, the device can predict sensations like smoothness, softness, prickliness, warmth, and dampness during fabric-skin touch.

References:

      1. SDL Atlas and Rycobel, “Fabric Touch Tester, Instruction Manual.” SDL Atlas.

      1. Hu, J.Y., et al., Fabric Touch Tester: Integrated evaluation of thermal–mechanical sensory properties of polymeric materials. Polymer Testing, 2006. 25(8): p. 1081-1090.

      1. Product manual M293 FTT, SDL Atlas.

      1. Musa, A.b.H., et al., Determination of comfort indices of fabrics using fabric touch tester (FTT). AIP Conference Proceedings, 2021. 2368(1).

      1. Rous M, A., et al., Handfeel of Single Jersey Fabrics as Assessed by a New Physical Method. Journal of Fashion Technology & Textile Engineering, 2018. s4.

      1. Musa, A.B.H., et al. Practical considerations of the FTT device for fabric comfort evaluation. 2018.

      1. Musa, A.B.H., et al., Analysis and Comparison of Thickness and Bending Measurements from Fabric Touch Tester (FTT) and Standard Methods. Autex Research Journal, 2018. 18(1): p. 51-60.

    To learn more on Laboratory testing and accreditation you can check on the following article:

        1. ISO/IEC 17025 Laboratory Accreditation Process

        1. ISO/IEC 17025 Laboratory Accreditation Advantages

        1. KEY STEPS FOR CONDUCTING AN EFFECTIVE QMS INTERNAL AUDIT

      Related Article

      Comment

      Leave a Comment

      Your email address will not be published. Required fields are marked *